The purpose of this demonstration is to explore reasonable parameters for dataset generation. We aim to follow established custom in the literature, as far as possible.
Because we centre the images on the visible light, there will usually
be a lot of empty background to crop. Making the calculations on
larger images will prevent many cropping artifacts.
We also note that the image size is limited by computer memory, when
they are used with machine learning. We were unable to use
images on a GPU with 50Gb memory, but work.
Parameter ranges
To build training sets we need to generate random sets of plausible images. The ranges and probability distribution may vary from study to study. The parameters we establish here are designed to be realistic examples of strong lensing, erring on the side of wider ranges.
| Parameter | Symnol | Identifier | Distribution | Range |
|---|---|---|---|---|
| Einstein radius | einsteinradius | Uniform | ||
| Source position | position.r | Uniform | ||
| Source location | position.phi | Uniform | ||
| Lens orientation | orientation | Uniform | ||
| Source orientation | Uniform | |||
| Lens ellipticity | ellipseratio | Uniform | ||
| Source size | sigma | Uniform | ||
| Sersic index | n_sersic | Uniform | ||
| Luminosity | luminosity | Exponential | , |
The source position is given in polar co-ordinates .
The distance is chosen to be inside or around the critical curve, hence the limit for some constant .
Angles are given in degrees in the source code and chosen uniformly from a half circle, because of symmetry.
The source is spherical with a sersic profile.
Dataset generation
Before we start, we import the required modules and check the CosmoSim version.
import CosmoSim
import CosmoSim.dataset as csd
import CosmoSim.Image as csimg
import CosmoSim as cs
import CosmoSim.datagen as csg
import matplotlib.pyplot as plt
import pandas as pd

print( CosmoSim.__version__ )
3.3.0
The CosmoSim.dataset module provides the functions to generate random datasets.
The probability distribution is specified by a nested dict, typically
defined in a TOML file, similar to those used in other CosmoSim modules.
However, the dataset submodule does not use the Parameters class for
its parameters at present.
cfg = csd.readtoml( "sie-dataset.toml" )
display( cfg )
{'simulator': {'model': 'Raytrace',
'size': 15000,
'nterms': 4,
'imagesize': 512,
'cropsize': 256,
'centred': True},
'dataset': {'directory': 'images'},
'lens': {'mode': 'SIE',
'einstein-min': 2.5,
'einstein-max': 75,
'orientation-min': 0,
'orientation-max': 180,
'ellipseratio-min': 0.1,
'ellipseratio-max': 0.9},
'source': {'mode': 'SersicSphere',
'n_sersic-min': 1,
'n_sersic-max': 5,
'luminosity-min': 20,
'luminosity-max': 80,
'luminosity-lambda': 2.0,
'sigma-min': 5,
'sigma-max': 50,
'position': 'relative'},
'position': {'phi-min': 0, 'phi-max': 360, 'r-relativemax': 1.2}}We see that this configuration is set up to generate 15000 images in 256256 format. We can see the parameter ranges for the lens and for the source, which is a sphere with sersic profile. It is set up to do raytrace simulation with a SIE lens.
Sampling the distribution
To get an impression of distribution, we can bulk generate configurations. Let’s first look at the dataset, as follows.
obs = [ csd.getline( cfg ) for ob in range(8) ]
df = pd.DataFrame( obs )
display(df)
[getline] idx=0
[getline] idx=0
[getline] idx=0
[getline] idx=0
[getline] idx=0
[getline] idx=0
[getline] idx=0
[getline] idx=0
To create the images we make a quick function to generate a each one.
def getImage(ob):
    param = cs.Parameters(cliconfig=cfg)
    param.setRow( ob )
    sim = csg.SimImage( param, verbose=0 )
    im = sim.getImage()
    csimg.crop( im, param.get( "cropsize" ), verbose=0 )
    return im
Each line of the function is as used above in the document, except that we have added cropping. Now we can quickly generate a list of images and display them.
import CosmoSim.Image as csimg

ims = [ getImage(ob) for ob in obs ]

fig = plt.figure(figsize=(20, 10))
fig.tight_layout(pad=0.0)
plt.subplots_adjust(hspace=0.1, wspace=0.1)

for idx,im in enumerate(ims):
    fig.add_subplot(2, 4, idx+1)
    csimg.imshow( im )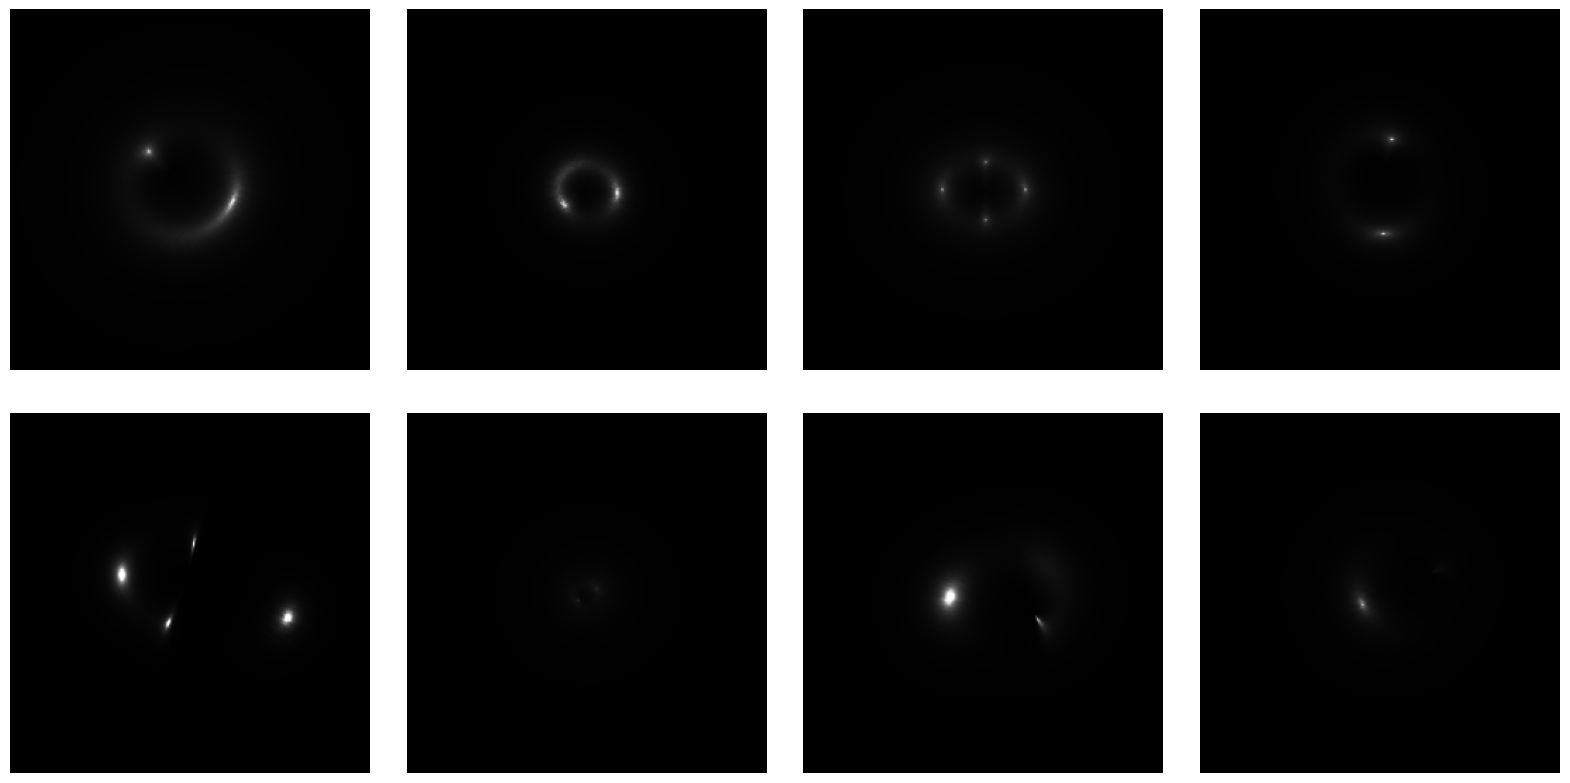
Closure
Using this dataset, we have trained a machine learning model, using images for training.
Continue to Evaluation of machine learning for SIE.