CosmoSim can add several annotations to generated images. This tutorial will show the ones available as of v3.0.0.
Preparation
We use the same basic setup and lens configuration as we used in CosmoSim Demo I. The following code is copied therefrom and trimmed.
import pandas as pd
import matplotlib.pyplot as plt
import numpy as np
from PIL import Image

import tomllib as tl

from CosmoSim.datagen import SimImage
import CosmoSim.Image as csimg
from CosmoSim import Parameters

with open( "Demo01.toml", 'rb') as f:
            toml = tl.load(f)

param = Parameters( toml )
imsim = SimImage( param, verbose=0 )
im = imsim.getImage()
csimg.imshow( im,  "Initial configuration" )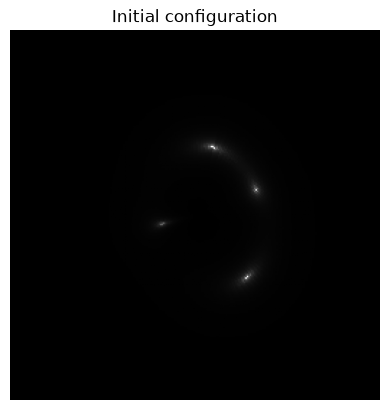
Annotation
The cosmological annotations is retrieved with the getAnnotated() method.
im = imsim.getAnnotated()
csimg.imshow( im,  "Annotated image" )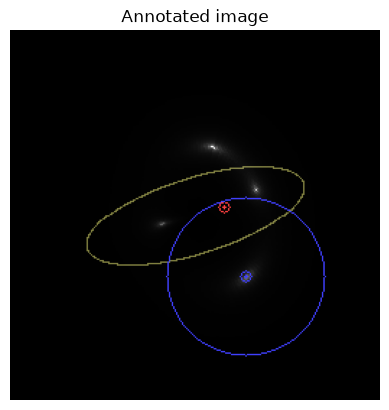
The critical curve is shown in white and the convergence ring in blue. The green point is the centre of light. In machine learning we would translate the image to centre it on the centre of image. We can also get the exact co-ordinates of this centre.
print( "Centre point", imsim.centrepoint )Centre point (np.float64(20.218618591066843), np.float64(5.911662614493025))
We can add an axis cross, which is useful to see the location of the origin, and hence also of the lens.
csimg.drawAxes( im )
csimg.imshow( im, "With axis cross" )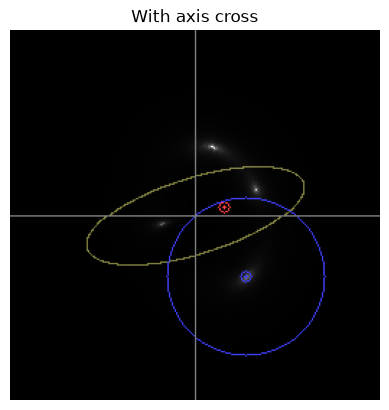
Note that the convergence ring passes through the centre of the lens, as it always should.
Fine-tuning the annotations
We can select which annotations to include, and also choose their colour.
im = imsim.getAnnotated(critical=(255,0,0),centrePoint=None,xiOffset=None,convergenceRing=(0,255,0))
csimg.imshow( im,  "Annotated image" )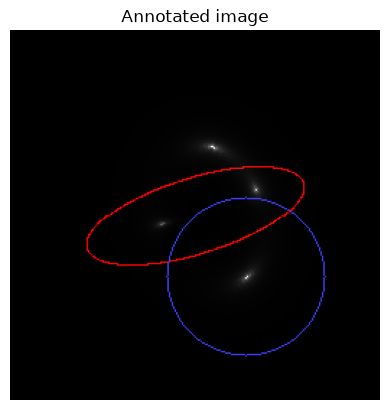
Each annotation has an argument which can be assigned an RGB colour or None.
We can also mark the actual source position, like this, with the centre of light in green and the actual source position in red.
im = imsim.getAnnotated(critical=(255,0,0),centrePoint=(0,255,0),xiOffset=None,convergenceRing=None,actualPosition=(0,0,255))
csimg.imshow( im,  "Annotated image" )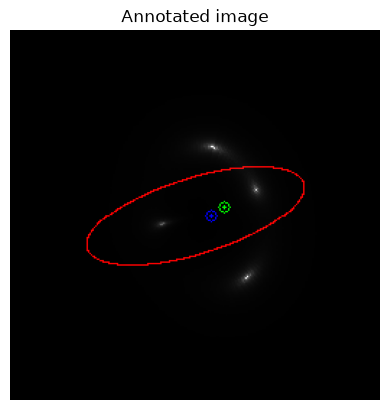
The source
The unlensed source can be displayed as follows.
im = imsim.getActualImage()
csimg.drawAxes( im )
plt.imshow( im, cmap='gray')
plt.title( "The source w/o lensing" )
plt.axis("off")
(np.float64(-0.5), np.float64(511.5), np.float64(511.5), np.float64(-0.5))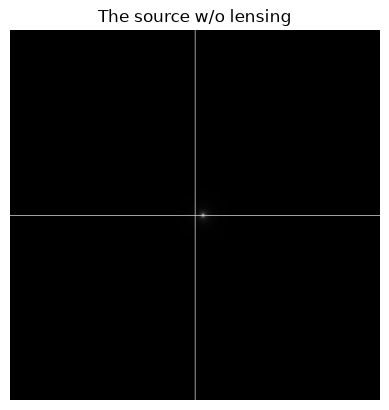
We barely see the tiny source which sits on the -axis. We could remove the axis cross to see it better.
Cropping
Generally, we use an oversized image for calculation, and then crop it down to a manageable size.
print( "Prior shape", im.shape )
im = csimg.crop( im )
print( "Posterior shape", im.shape )
csimg.imshow( im, "Cropped image" )
Prior shape (512, 512)
[crop] cropsize=256
Posterior shape (256, 256)
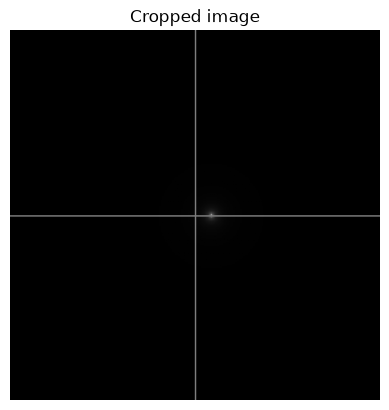
The default cropsize is 256, but in the batch process, the sizes are read
from simulator.imagesize and simulator.cropsize. We could give it as
an argument to crop() too.
im = csimg.crop( im, 128 )
plt.imshow( im, cmap='gray')
plt.title( "Much cropped image" )
plt.axis("off")
[crop] cropsize=128
(np.float64(-0.5), np.float64(127.5), np.float64(127.5), np.float64(-0.5))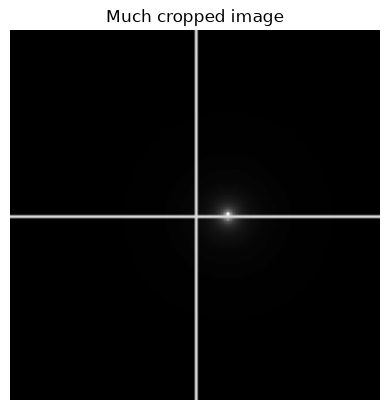
Closure
Annotation is work in process, as we mentioned. Stay tuned.